因為疫情我已在家上班一個月了, 除了公務外, 公司的線上課程每天都要看, 最近上了台大張佑成老師的 Python + Excel 整合術課程 (超棒), 學到了另一個 Excel 套件 xlwings 的基本用法, 但 xlwings 只能用在有安裝 Excel 軟體的 Windows 與 MacOS 上, 於是我又回頭繼續 OpenPyXL 的學習, 因為它是目前唯一可以在沒有 Excel 的環境下讀寫編輯 xlsx 檔案的套件, 所以若要在樹莓派 Linux 上操作 xlsx 檔, 首選便是 OpenPyXL 啦!
本系列前一篇文章參考 :
官網教學資料參考 :
本篇主要是測試 Worksheet 工作表物件與操作工作表的內容, 在此之前先摘要整理前一篇關於工作簿與工作表操作之指令 :
- 匯入 openpyxl 套件 :
import openpyxl as xl - 載入現有 xlsx 檔為工作簿物件 :
wb=xl.load_excel('users.xlsx')
wb=xl.load_excel(r'C:\test\users.xlsx') - 建立空白工作簿物件 :
wb.Workbook() - 將工作簿物件儲存為 xlsx 檔 (若有用 Excel 軟體開啟須先關檔) :
wb.save('users.xlsx')
wb.save(r'C:\test\users.xlsx') - 取得工作表名稱串列 :
wb.sheetnames - 取得工作表物件串列 :
wb.worksheets - 取得作用中的工作表物件 :
wb.active - 從工作簿物件取得工作表物件 :
wb.worksheets[0] # 使用 worksheets 串列索引
wb['工作表1'] # 使用工作表名稱索引 - 建立新工作表 :
wb.create_sheet() # 自動產生名稱
wb.create_sheet('工作表2') # 自訂名稱 - 複製工作表 :
wb.copy_worksheet(sheet1) # 須傳入工作表物件 - 刪除工作表 :
wb.remove(sheet1) # 須傳入工作表物件
以下測試會使用到下面兩個測試檔案 :
下載後放在與程式相同之工作目錄下即可.
6. 工作表物件 Worksheet 與儲存格物件 Cell 之基本操作 :
由上述可知, 利用 Workbook 物件的 worksheets 屬性可取得工作簿中全部工作表物件串列, 透過 [index] 運算子即可取得特定的工作表 Worksheet 物件, 利用 Worksheet 物件的屬性與方法可以對工作表的列, 欄, 以及儲存格進行操作.
首先使用 eval() 求值函式取得 Worksheet 物件成員的參考, 然後透過迴圈來檢視各成員的類型是屬性還是方法, 例如 :
>>> import openpyxl as xl
>>> wb=xl.load_workbook('users.xlsx') # 載入試算表檔案
>>> sheet=wb['我的工作表1']
>>> members=dir(ws[0])
>>> for mbr in members: # 走訪 Workbook 物件成員
obj=eval('ws[0].' + mbr) # 用 eval() 求值取得 wb.成員之參考
if not mbr.startswith('_'): # 走訪所有不是 "_" 開頭的成員
print(mbr, type(obj))
BREAK_COLUMN <class 'int'>
BREAK_NONE <class 'int'>
BREAK_ROW <class 'int'>
HeaderFooter <class 'openpyxl.worksheet.header_footer.HeaderFooter'>
ORIENTATION_LANDSCAPE <class 'str'>
ORIENTATION_PORTRAIT <class 'str'>
PAPERSIZE_A3 <class 'str'>
PAPERSIZE_A4 <class 'str'>
PAPERSIZE_A4_SMALL <class 'str'>
PAPERSIZE_A5 <class 'str'>
PAPERSIZE_EXECUTIVE <class 'str'>
PAPERSIZE_LEDGER <class 'str'>
PAPERSIZE_LEGAL <class 'str'>
PAPERSIZE_LETTER <class 'str'>
PAPERSIZE_LETTER_SMALL <class 'str'>
PAPERSIZE_STATEMENT <class 'str'>
PAPERSIZE_TABLOID <class 'str'>
SHEETSTATE_HIDDEN <class 'str'>
SHEETSTATE_VERYHIDDEN <class 'str'>
SHEETSTATE_VISIBLE <class 'str'>
active_cell <class 'str'>
add_chart <class 'method'>
add_data_validation <class 'method'>
add_image <class 'method'>
add_pivot <class 'method'>
add_table <class 'method'>
append <class 'method'>
auto_filter <class 'openpyxl.worksheet.filters.AutoFilter'>
calculate_dimension <class 'method'>
cell <class 'method'>
col_breaks <class 'openpyxl.worksheet.pagebreak.ColBreak'>
column_dimensions <class 'openpyxl.worksheet.dimensions.DimensionHolder'>
columns <class 'generator'>
conditional_formatting <class 'openpyxl.formatting.formatting.ConditionalFormattingList'>
data_validations <class 'openpyxl.worksheet.datavalidation.DataValidationList'>
delete_cols <class 'method'>
delete_rows <class 'method'>
dimensions <class 'str'>
encoding <class 'str'>
evenFooter <class 'openpyxl.worksheet.header_footer.HeaderFooterItem'>
evenHeader <class 'openpyxl.worksheet.header_footer.HeaderFooterItem'>
firstFooter <class 'openpyxl.worksheet.header_footer.HeaderFooterItem'>
firstHeader <class 'openpyxl.worksheet.header_footer.HeaderFooterItem'>
formula_attributes <class 'dict'>
freeze_panes <class 'NoneType'>
insert_cols <class 'method'>
insert_rows <class 'method'>
iter_cols <class 'method'>
iter_rows <class 'method'>
legacy_drawing <class 'NoneType'>
max_column <class 'int'>
max_row <class 'int'>
merge_cells <class 'method'>
__main__:1: DeprecationWarning: Call to deprecated function merged_cell_ranges (Use ws.merged_cells.ranges).
merged_cell_ranges <class 'list'>
merged_cells <class 'openpyxl.worksheet.cell_range.MultiCellRange'>
mime_type <class 'str'>
min_column <class 'int'>
min_row <class 'int'>
move_range <class 'method'>
oddFooter <class 'openpyxl.worksheet.header_footer.HeaderFooterItem'>
oddHeader <class 'openpyxl.worksheet.header_footer.HeaderFooterItem'>
orientation <class 'NoneType'>
page_breaks <class 'tuple'>
page_margins <class 'openpyxl.worksheet.page.PageMargins'>
page_setup <class 'openpyxl.worksheet.page.PrintPageSetup'>
paper_size <class 'NoneType'>
parent <class 'openpyxl.workbook.workbook.Workbook'>
path <class 'str'>
print_area <class 'NoneType'>
print_options <class 'openpyxl.worksheet.page.PrintOptions'>
print_title_cols <class 'NoneType'>
print_title_rows <class 'NoneType'>
print_titles <class 'NoneType'>
protection <class 'openpyxl.worksheet.protection.SheetProtection'>
row_breaks <class 'openpyxl.worksheet.pagebreak.RowBreak'>
row_dimensions <class 'openpyxl.worksheet.dimensions.DimensionHolder'>
rows <class 'generator'>
scenarios <class 'openpyxl.worksheet.scenario.ScenarioList'>
selected_cell <class 'str'>
set_printer_settings <class 'method'>
sheet_format <class 'openpyxl.worksheet.dimensions.SheetFormatProperties'>
sheet_properties <class 'openpyxl.worksheet.properties.WorksheetProperties'>
sheet_state <class 'str'>
sheet_view <class 'openpyxl.worksheet.views.SheetView'>
show_gridlines <class 'NoneType'>
show_summary_below <class 'bool'>
show_summary_right <class 'bool'>
tables <class 'openpyxl.worksheet.table.TableList'>
title <class 'str'>
unmerge_cells <class 'method'>
values <class 'generator'>
views <class 'openpyxl.worksheet.views.SheetViewList'>
Worksheet 物件的常用屬性如下表 :
| Worksheet 物件常用屬性 | 說明 |
| title | 工作表名稱 |
| max_row | 工作表內的資料列數 (唯讀) |
| max_column | 工作表內的資料欄數 (唯讀) |
| rows | 包裹列的儲存格之產生器 (generator) |
| columns | 包裹欄的儲存格之產生器 (generator) |
| freeze_panes | 凍結指定座標儲存格上方列與左側欄 (預設 'A1' 或 None=不凍結) |
| row_dimensions | 列的尺寸設定物件 (其 height 屬性用來設定列儲存格高度) |
| column_dimensions | 欄的尺寸設定物件 (其 width 屬性用來設定欄儲存格寬度) |
| conditional_formatting | 格式化條件設定, 值為一 ConditionalFormattingList 物件 |
其中 row_dimensions 與 column_dimensions 屬性分別用來設定列高與欄寬; freeze_panes 用來凍結儲存格所在上方全部列與左側全部欄 (不包含儲存格所在之列或欄), 主要用在凍結第一列的欄名, 這樣當資料列很多往下捲動時第一列的欄名仍紋風不動, 方便閱讀資料. max_row 與 max_column 標示了工作表內容的範圍 (唯讀); rows 與 columns 則是列與欄儲存格之產生器 (generator), 只要將其傳給 list() 就能產生可迭代物件, 關於產生器參考 :
Worksheet 物件的常用方法如下表 :
| Worksheet 物件常用方法 | 說明 |
| cell(row, column) | 取得第 row 列第 column 欄之 Cell 物件 (索引都是 1 起始, A 欄=1) |
| append(iterable) | 將可迭代物件 (tuple/list/dict) 內容添加到工作表最後一列資料後面 |
| iter_rows(r1, r2, c1, c2) | 逐列產生 ['c1r1':'c2r2'] 範圍內的儲存格物件, 傳回 generator |
| iter_cols(r1, r2, c1, c2) | 逐欄產生 ['c1r1':'c2r2'] 範圍內的儲存格物件, 傳回 generator |
| insert_rows(id [,num=1]) | 在指定列 id 前面插入 num 列空白列 |
| insert_cols(id [,num=1]) | 在指定欄 id 左方插入 num 欄空白欄 |
| delete_rows(id [,num=1]) | 刪除指定列 id 起共 num 列資料 |
| delete_cols(id [,num=1]) | 刪除指定欄 id 起共 num 欄資料 |
| move_range(range, rows, cols) | 將指定範圍 range (例如 'B2:D5') 內的儲存格移動 rows 列 cols 欄 (正=向下/向左, 負=向上/向右) |
| merge_cells(range) | 將指定範圍 range (例如 'B2:D5') 內的儲存格合併 |
| unmerge_cells(range) | 將指定範圍 range (例如 'B2:D5') 內的儲存格取消合併 |
| add_image(img, anchor) | 在儲存格座標 anchor (例如 'A1') 插入圖片 img (Image 物件) |
| add_chart(chart, anchor) | 在儲存格座標 anchor (例如 'A1') 插入圖表 chart (Chart 物件) |
其中 move_range() 方法可將指定範圍 range 內的儲存格移動 rows 列與 cols 欄 (預設均為 0, 表示不移動), rows 為正往下移動為負往上移動; cols 為正往左移動為負往右移動, 目標區域的原資料會被覆蓋. merge_cells() 則可將指定範圍 range 內的儲存格合併為一格, 而 unmerge_cells() 方法則是將已合併為一格之指定範圍 range 內儲存格取消合併. 注意, 存取合併儲存格時是以合併前之左上角儲存格為索引座標.
以下分別測試這些主要的屬性與方法 :
(1). 取得工作表內容之列數與欄數:
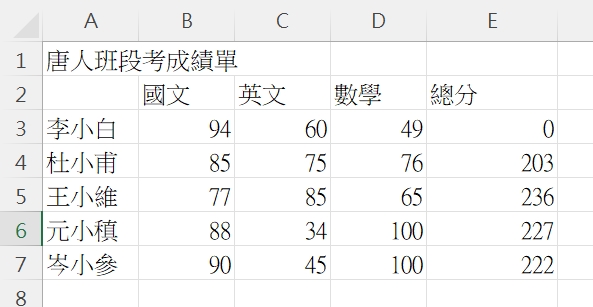
從上面 GitHub 下載 scores.xlsx 檔案放置於工作目錄下, 用 Excel 軟體開啟可知裡面有一個名為 '工作表1' 的工作表, 內容是學生的國英數成績, 占用 4 列 5 欄 :

用 openpyxl 載入後取得其中的工作表物件, :
>>> wb=xl.load_workbook('scores.xlsx')
>>> wb.worksheets
[<Worksheet "工作表1">]
>>> sheet1=wb.worksheets[0] # 也可以用 wb['工作表1'] 取得
>>> sheet1
<Worksheet "工作表1">
>>> sheet1.title # 工作表名稱
'工作表1'
>>> sheet1.max_row # 工作表內容占幾列
4
>>> sheet1.max_column # 工作表內容占幾欄
5
這個 max_row 與 max_culumn 在以迴圈取出內容時會用到. 這兩個值也可以將任一列或欄的儲存格物件串列傳給 len() 得到, 例如 :
>>> len(sheet1['A']) # 取得 A 欄之儲存格物件串列後傳給 len()
4
>>> len(sheet1[1]) # 取得第一列之儲存格物件串列後傳給 len()
5
(2). 呼叫工作表物件的 cell() 方法取得儲存格物件 :
呼叫工作表物件的 cell() 方法並傳入 row 與 column 參數指定列與欄索引即可取得代表儲存格的 Cell 物件, 注意這兩個參數都是 1 起始的, Excel 的列索引本來就是用 1, 2, 3, 4, ... 定位的, 但欄索引此處也要改用 1, 2, 3, 4, ... 來定位 column 參數, 亦即 A 欄要用 column=1, B 欄要用 column=2, ... 依此類推, 例如 :
>>> wb=xl.load_workbook('scores.xlsx')
>>> sheet1=wb['工作表1'] # 取得做表物件
>>> cell=sheet1.cell(row=2, column=3) # 取得第 2 列第 3 欄 (C2) 儲存格
>>> cell
<Cell '工作表1'.C2>
>>> type(cell)
<class 'openpyxl.cell.cell.Cell'> # Cell 物件
cell() 方法會傳回一個 Cell 物件, 此處第二列第三欄為 C2 儲存格 :

可用 eval(0, dir(), 與 type() 來檢視 Cell 物件的成員 :
>>> members=dir(cell)
>>> for mbr in members:
obj=eval('cell.' + mbr)
if not mbr.startswith('_'):
print(mbr, type(obj))
alignment <class 'openpyxl.styles.proxy.StyleProxy'>
base_date <class 'datetime.datetime'>
border <class 'openpyxl.styles.proxy.StyleProxy'>
check_error <class 'method'>
check_string <class 'method'>
col_idx <class 'int'>
column <class 'int'>
column_letter <class 'str'>
comment <class 'NoneType'>
coordinate <class 'str'>
data_type <class 'str'>
encoding <class 'str'>
fill <class 'openpyxl.styles.proxy.StyleProxy'>
font <class 'openpyxl.styles.proxy.StyleProxy'>
has_style <class 'bool'>
hyperlink <class 'NoneType'>
internal_value <class 'int'>
is_date <class 'bool'>
number_format <class 'str'>
offset <class 'method'>
parent <class 'openpyxl.worksheet.worksheet.Worksheet'>
pivotButton <class 'bool'>
protection <class 'openpyxl.styles.proxy.StyleProxy'>
quotePrefix <class 'bool'>
row <class 'int'>
style <class 'str'>
style_id <class 'int'>
value <class 'int'>
可見 Cell 儲存格物件的成員都是屬性, 沒有方法, 常用之屬性如下表 :
| Cell 物件常用屬性 | 說明 |
| column | 儲存格所在之欄索引 (1 起始之整數) |
| column_letter | 儲存格所在之欄索引字串 ('A', 'B', 'C', ...) |
| row | 儲存格所在之列索引 (1 起始之整數) |
| data_type | 儲存格之資料型態 |
| number_format | 儲存格之數值格式 |
| value | 儲存格之內容 |
| font | 儲存格內容的字型 (值為 Font 物件) |
| alignment | 儲存格對齊 vertical=top/center/bottom, horizontal=left/center/right |
| border | 儲存格框線, 值=Border 物件 (屬性 left/right/top/bottom=Side 物件) |
| fill | 儲存格背景色, 值為 PatternFill 物件 |
屬性 column 與 column_letter 分別記錄 Cell 物件所在的欄索引, column 是整數索引, column_letter 是字串索引; font 屬性用來設定儲存格的字型樣式 (name, size, color, bold, italic, strike 等), 其值為一個 openpyxl.styles.Font 物件. alignment 屬性值為一個 Alignment 物件; border 屬性值為一個 Border 物件; fill 屬性值為一個 PatternFill 物件, 這四個屬性為儲存格常用的格式設定屬性.
儲存格物件屬性其中最常用的是 value 屬性, 可用來存取儲存格內容. 以上面的 C2 為例 :
>>> cell=sheet1.cell(row=2, column=3) # 取得第 2 列第 3 欄 (C2) 儲存格
>>> cell.row # 儲存格所在之列索引
2
>>> cell.column # 儲存格所在之欄索引
3
>>> cell.column_letter # 儲存格所在之欄索引字串
'C'
>>> cell.value # 儲存格之內容
60
>>> cell.data_type # 儲存格之資料型態
'n'
>>> cell.number_format # 儲存格之數值格式
'General'
透過 value 屬性可以存取儲存格內容, 亦即可以讀取也可以寫入, 這是使用 Python 操作 Excel 試算表的核心運算, 例如 :
>>> cell=sheet1.cell(row=2, column=3) # 取得 C3 儲存格物件
>>> cell.value # 讀取儲存格內容
60
>>> cell.value=70 # 更改儲存格內容
>>> cell.value
70
除了使用 Cell 物件的 value 屬性賦值來寫入儲存格內容外, 還可以在呼叫 cell() 方法時傳入 value 參數來寫入, 語法如下 :
工作表物件.cell(row, column, value)
例如 :
>>> cell=sheet1.cell(row=2, column=3, value=80)
>>> cell.value
80
注意, 若要將公式寫入儲存格, 必須以字串型態寫入, 例如 cell.value='=SUM(A1:B1)'.
(3). 使用 [] 運算子取得儲存格物件:
除了呼叫 Worksheet 物件的 cell() 方法取得 Cell 物件外, 也可以用 [] 運算子, 以儲存格索引座標字串例如 'A1', 'C3', 'E4' 等當索引來取得, 其格式為 :
工作表物件['儲存格座標']
例如 :
>>> cell=sheet1['C2']
>>> cell
<Cell '工作表1'.C2>
>>> type(cell)
<class 'openpyxl.cell.cell.Cell'>
>>> cell.value
60
也可以用 [] 運算子以 1 起始的列索引來選取列資料的 Cell 物件, 語法如下 :
工作表物件[列索引]
以上面的 scores.xlsx 為例, 第 2 列為李小白成績 :
>>> sheet1[2] # 取得第二列的 Cell 物件串列
(<Cell '工作表1'.A2>, <Cell '工作表1'.B2>, <Cell '工作表1'.C2>, <Cell '工作表1'.D2>, <Cell '工作表1'.E2>)
>>> for cell in sheet1[2]: # 迭代第 2 列中的 Cell 物件
print(cell.value, end='\t') # 印出 Cell 物件之值
李小白 94 60 49 =SUM(B2:D2)
同樣地, 可以用 [] 運算子以欄索引字串來選取欄資料的 Cell 物件, 語法如下 :
工作表物件['欄索引']
以上面的 scores.xlsx 為例, 第 2 欄為國文成績 :
>>> sheet1['B'] # 取得第二欄的 Cell 物件串列
(<Cell '工作表1'.B1>, <Cell '工作表1'.B2>, <Cell '工作表1'.B3>, <Cell '工作表1'.B4>)
>>> for cell in sheet1['B']:
print(cell.value, end='\n') # 以跳行結尾
國文
94
85
77
除此之外還可以在 [] 中使用座標索引切片來取得一個矩形範圍內的 Cell 物件, 語法為 :
工作表物件['左上角座標' : '右下角座標'] 或
工作表物件['左上角座標 : 右下角座標']
例如 sheet1['A2' : 'E4'] 就可取得 A2 至 E4 間的矩形區域內的所有儲存格物件, 結果會以巢狀 tuple 傳回, 內部 tuple 由每列之 Cell 物件構成, 然後各列再組成外部 tuple, 例如 :
>>> cell_range=sheet1['B2':'E4']
>>> cell_range
((<Cell '工作表1'.B2>, <Cell '工作表1'.C2>, <Cell '工作表1'.D2>, <Cell '工作表1'.E2>), (<Cell '工作表1'.B3>, <Cell '工作表1'.C3>, <Cell '工作表1'.D3>, <Cell '工作表1'.E3>), (<Cell '工作表1'.B4>, <Cell '工作表1'.C4>, <Cell '工作表1'.D4>, <Cell '工作表1'.E4>))
>>> type(cell_range)
<class 'tuple'>
>>> sheet1['B2:E4'] # [] 內的範圍用 'B2:E4' 或 'B2':'E4' 都可以
((<Cell '工作表1'.B2>, <Cell '工作表1'.C2>, <Cell '工作表1'.D2>, <Cell '工作表1'.E2>), (<Cell '工作表1'.B3>, <Cell '工作表1'.C3>, <Cell '工作表1'.D3>, <Cell '工作表1'.E3>), (<Cell '工作表1'.B4>, <Cell '工作表1'.C4>, <Cell '工作表1'.D4>, <Cell '工作表1'.E4>))
可以用雙層迴圈迭代此巢狀 tuple 來取得此範圍內的儲存格內容 :
>>> for row in cell_range: # 迭代範圍內之每列
for cell in row: # 迭代範圍內每列之儲存格物件
print(cell.value, end='\t') # 每列 Cell 內容以 Tab 隔開
print()
94 60 49 =SUM(B2:D2)
85 75 76 =SUM(B3:D3)
77 85 65 =SUM(B4:D4)
可見這些都是 B2 與 A4 範圍內的儲存格內容. 注意, [] 內的儲存格範圍雖然兩種用法都可以, 但方法中的 range 座標只能用 '左上角座標 : 右下角座標', 因為那是字串.
(4). 利用工作表物件的 rows 與 columns 屬性取得儲存格物件 :
在上面 Worksheet 物件的常用屬性中有 rows 與 columns 這兩個屬性, 它們的值是一個儲存格物件的產生器 (generator), 只要將產生器傳入 list() 就可以用來產生列儲存格與欄儲存格組成之可迭代物件 (串列), 例如 :
>>> sheet1.rows # 值為產生器
<generator object Worksheet._cells_by_row at 0x00000162BB27C750>
>>> sheet1.columns # 值為產生器
<generator object Worksheet._cells_by_col at 0x00000162BB27CDE0>
將這兩個產生器傳入 list() 產生串列 :
>>> list(sheet1.rows) # 產生各列儲存格打包成 tuple 之串列
[(<Cell '工作表1'.A1>, <Cell '工作表1'.B1>, <Cell '工作表1'.C1>, <Cell '工作表1'.D1>, <Cell '工作表1'.E1>), (<Cell '工作表1'.A2>, <Cell '工作表1'.B2>, <Cell '工作表1'.C2>, <Cell '工作表1'.D2>, <Cell '工作表1'.E2>), (<Cell '工作表1'.A3>, <Cell '工作表1'.B3>, <Cell '工作表1'.C3>, <Cell '工作表1'.D3>, <Cell '工作表1'.E3>), (<Cell '工作表1'.A4>, <Cell '工作表1'.B4>, <Cell '工作表1'.C4>, <Cell '工作表1'.D4>, <Cell '工作表1'.E4>)]
>>> list(sheet1.columns) # 產生各欄儲存格打包成 tuple 之串列
[(<Cell '工作表1'.A1>, <Cell '工作表1'.A2>, <Cell '工作表1'.A3>, <Cell '工作表1'.A4>), (<Cell '工作表1'.B1>, <Cell '工作表1'.B2>, <Cell '工作表1'.B3>, <Cell '工作表1'.B4>), (<Cell '工作表1'.C1>, <Cell '工作表1'.C2>, <Cell '工作表1'.C3>, <Cell '工作表1'.C4>), (<Cell '工作表1'.D1>, <Cell '工作表1'.D2>, <Cell '工作表1'.D3>, <Cell '工作表1'.D4>), (<Cell '工作表1'.E1>, <Cell '工作表1'.E2>, <Cell '工作表1'.E3>, <Cell '工作表1'.E4>)]
可見 list(sheet1.rows) 會將每一列儲存格物件先打包成 tuple, 然後再組成串列; 反之, list(sheet1.columns) 則是將每欄儲存格物件先打包成 tuple, 然後再組成串列. 只要用迴圈迭代這些串列即可依序取得 Cell 儲存格物件與其內容, 例如迭代第 2 列李小白資料 :
>>> for cell in list(sheet1.rows)[1]: # 串列索引 1 為 scores.xlsx 的第 2 列
print(cell.value)
李小白
94
60
49
=SUM(B2:D2)
注意, 這裡最後一欄的總分欄因為用 load_workbook() 載入 xlsx 檔時沒有傳入參數 data_only=True, 所以公式儲存格預設不會先執行計算, 故載入原始公式.
迭代第三欄的英文成績例如 :
>>> for cell in list(sheet1.columns)[2]: # 串列索引 2 為 scores.xlsx 的第 3 列
print(cell.value)
英文
60
75
85
如果要取得工作表中的全部資料, 就必須用雙層迴圈, 第一種做法是先迭代列, 再迭代欄中的儲存格, 這種方式與 Excel 中的排列方式一致, 例如 :
>>> for row in sheet1.rows: # 迭代列
for cell in row: # 迭代列中的各欄儲存格
print(cell. value, end='\t')
print()
None 國文 英文 數學 總分
李小白 94 60 49 =SUM(B2:D2)
杜小甫 85 75 76 =SUM(B3:D3)
王小維 77 85 65 =SUM(B4:D4)
當然也可以先迭代欄, 然後迭代每欄中的各列儲存格, 例如 :
>>> for column in sheet1.columns:
for cell in column:
print(cell. value, end='\t')
print()
None 李小白 杜小甫 王小維
國文 94 85 77
英文 60 75 85
數學 49 76 65
總分 =SUM(B2:D2) =SUM(B3:D3) =SUM(B4:D4)
可見這種迭代方式與 Excel 的排列欄與列顛倒.
(5). 呼叫工作表物件的 iter_rows() 與 iter_cols() 取得儲存格產生器 :
iter_rows() 與 iter_cols() 這兩個方法與上面的 rows 與 columns 屬性一樣都是傳回一個範圍的儲存格產生器 (generator), 語法如下 :
iter_rows(min_row, max_row, min_col, max_col)
iter_cols(min_row, max_row, min_col, max_col)
傳入的四個參數即範圍之座標 (皆為整數索引, 故 A 欄要用 1, B 欄要用 2, ....), 兩者的差別是產生的順序, iter_rows() 是逐列 (先列後欄); 而 iter_cols() 是逐欄 (先欄後列).
例如 :
>>> sheet1.iter_rows(1, 6, 1, 5)
<generator object Worksheet._cells_by_row at 0x00000162BB2FC390>
>>> sheet1.iter_cols(1, 6, 1, 5)
<generator object Worksheet._cells_by_col at 0x00000162BB2FC6D8>
只要將產生器傳入 list() 就可以將此範圍內的儲存格依序產生出來 :
>>> list(sheet1.iter_rows(1, 6, 1, 5)) # 先列後欄
[(<Cell '工作表1'.A1>, <Cell '工作表1'.B1>, <Cell '工作表1'.C1>, <Cell '工作表1'.D1>, <Cell '工作表1'.E1>), (<Cell '工作表1'.A2>, <Cell '工作表1'.B2>, <Cell '工作表1'.C2>, <Cell '工作表1'.D2>, <Cell '工作表1'.E2>), (<Cell '工作表1'.A3>, <Cell '工作表1'.B3>, <Cell '工作表1'.C3>, <Cell '工作表1'.D3>, <Cell '工作表1'.E3>), (<Cell '工作表1'.A4>, <Cell '工作表1'.B4>, <Cell '工作表1'.C4>, <Cell '工作表1'.D4>, <Cell '工作表1'.E4>), (<Cell '工作表1'.A5>, <Cell '工作表1'.B5>, <Cell '工作表1'.C5>, <Cell '工作表1'.D5>, <Cell '工作表1'.E5>), (<Cell '工作表1'.A6>, <Cell '工作表1'.B6>, <Cell '工作表1'.C6>, <Cell '工作表1'.D6>, <Cell '工作表1'.E6>)]
>>> list(sheet1.iter_cols(1, 6, 1, 5)) # 先欄後列
[(<Cell '工作表1'.A1>, <Cell '工作表1'.A2>, <Cell '工作表1'.A3>, <Cell '工作表1'.A4>, <Cell '工作表1'.A5>), (<Cell '工作表1'.B1>, <Cell '工作表1'.B2>, <Cell '工作表1'.B3>, <Cell '工作表1'.B4>, <Cell '工作表1'.B5>), (<Cell '工作表1'.C1>, <Cell '工作表1'.C2>, <Cell '工作表1'.C3>, <Cell '工作表1'.C4>, <Cell '工作表1'.C5>), (<Cell '工作表1'.D1>, <Cell '工作表1'.D2>, <Cell '工作表1'.D3>, <Cell '工作表1'.D4>, <Cell '工作表1'.D5>), (<Cell '工作表1'.E1>, <Cell '工作表1'.E2>, <Cell '工作表1'.E3>, <Cell '工作表1'.E4>, <Cell '工作表1'.E5>), (<Cell '工作表1'.F1>, <Cell '工作表1'.F2>, <Cell '工作表1'.F3>, <Cell '工作表1'.F4>, <Cell '工作表1'.F5>)]
可見 iter_rows() 產出的結果與 rows 屬性一樣; 而 iter_cols() 產出的結果與 columns 屬性一樣.
(6). 呼叫工作表物件的 insert_rows() 方法插入空白列 :
呼叫 Worksheet 物件的 insert_rows() 方法可在指定的列索引前面插入一個或多個空列, 語法為 :
工作表物件.insert_rows(idx [, num=1])
其中 idx 為欲插入的列索引, 備選參數為要插入的列數 (預設是 1 列), 例如 :
>>> sheet1.insert_rows(3) # 在第 3 列前面插入一個空列
>>> for row in sheet1.rows:
for cell in row:
print(cell. value, end='\t')
print()
None 國文 英文 數學 總分
李小白 94 60 49 =SUM(B2:D2)
None None None None None
杜小甫 85 75 76 =SUM(B3:D3)
王小維 77 85 65 =SUM(B4:D4)
可見在原第三列 (杜小甫) 前面添加了一個空列, 內容都是 None. 如果傳入第二參數 num 則可以一 次添加好幾個空列, 例如 :
>>> sheet1.insert_rows(3, 2) # 在第三列前面插入兩個空列
>>> for row in sheet1.rows:
for cell in row:
print(cell. value, end='\t')
print()
None 國文 英文 數學 總分
李小白 94 60 49 =SUM(B2:D2)
None None None None None
None None None None None
None None None None None
杜小甫 85 75 76 =SUM(B3:D3)
王小維 77 85 65 =SUM(B4:D4)
這些空列都不會即時反應在開啟的 Excel 程式裡, 必須呼叫 wb.save('scores.xlsxsx') 存檔才行, 但若已經開啟 scores.xlsx 必須先關檔 :
>>> wb.save('scores.xlsx')
再次開啟 scores.xlsx 檔即可看到這三列空白列 :

(7). 呼叫工作表物件的 delete_rows() 方法刪除列 :
呼叫 Worksheet 物件的 delete_rows() 方法可從指定的列索引開始刪除一個或多個空列, 語法為 :
工作表物件.delete_rows(idx [, num=1])
其中 idx 為欲刪除的列索引, 備選參數為要刪除的列數 (預設是 1 列), 首先來看一下目前工作表物件中的內容 :
>>> for row in sheet1.rows:
for cell in row:
print(cell. value, end='\t')
print()
None 國文 英文 數學 總分
李小白 94 60 49 =SUM(B2:D2)
None None None None None
None None None None None
None None None None None
杜小甫 85 75 76 =SUM(B3:D3)
王小維 77 85 65 =SUM(B4:D4)
現在要呼叫 delete_rows() 來刪除列 3, 4, 5 這三個空白列, 首先只傳入列索引 3 表示只刪除第三列這一列, 例如 :
>>> sheet1.delete_rows(3) # 只刪除第三列
>>> for row in sheet1.rows:
for cell in row:
print(cell. value, end='\t')
print()
None 國文 英文 數學 總分
李小白 94 60 49 =SUM(B2:D2)
None None None None None
None None None None None
杜小甫 85 75 76 =SUM(B3:D3)
王小維 77 85 65 =SUM(B4:D4)
可見第一個空白列 (第三列) 已被刪除, 現在剩下列索引為 3, 4 的兩個空白列 (刪除後下方各列索引往上補位). 若傳入第二參數 num 則可一次刪除從列索引 idx 起往下的連續多列資料, 例如 :
>>> sheet1.delete_rows(3, 2) # 從列索引 3 開始往下刪除連續 2 列
>>> for row in sheet1.rows:
for cell in row:
print(cell. value, end='\t')
print()
None 國文 英文 數學 總分
李小白 94 60 49 =SUM(B2:D2)
杜小甫 85 75 76 =SUM(B3:D3)
王小維 77 85 65 =SUM(B4:D4)
可見所有空白列都已經被刪除了.
(8). 呼叫工作表物件的 insert_cols() 方法插入空白欄 :
呼叫 Worksheet 物件的 insert_cols() 方法可在指定的欄索引前面 (即左邊) 插入一個或多個空白欄, 語法為 :
工作表物件.insert_cols(idx [, num=1])
其中 idx 為欲插入的欄索引, 備選參數為要插入的欄數 (預設是 1 欄), 例如 :
>>> sheet1.insert_cols(3) # 在第 3 欄前面 (左邊) 插入一個空白欄
>>> for row in sheet1.rows:
for cell in row:
print(cell. value, end='\t')
print()
None 國文 None 英文 數學 總分
李小白 94 None 60 49 =SUM(B2:D2)
杜小甫 85 None 75 76 =SUM(B3:D3)
王小維 77 None 85 65 =SUM(B4:D4)
可見在原第三欄 (英文) 前面或左方添加了一個空白欄, 內容都是 None. 如果傳入第二參數 num 則可以一 次添加好幾個空欄, 現在第三欄是 None 欄, 下面範例是在其前面插入兩個空欄 :
>>> sheet1.insert_cols(3, 2) # 在第三欄前面 (左方) 插入兩個空欄
>>> for row in sheet1.rows:
for cell in row:
print(cell. value, end='\t')
print()
None 國文 None None None 英文 數學 總分
李小白 94 None None None 60 49 =SUM(B2:D2)
杜小甫 85 None None None 75 76 =SUM(B3:D3)
王小維 77 None None None 85 65 =SUM(B4:D4)
若已經開啟 scores.xlsx 先關檔, 然後呼叫 wb.save('scores.xlsxsx') 存檔再用 Excel 開啟便能看到上面兩個 insert_cols() 插入的三個空欄了 : :
>>> wb.save('scores.xlsx')
再次開啟 scores.xlsx 檔即可看到這三列空白欄 :

(9). 呼叫工作表物件的 delete_cols() 方法刪除欄 :
呼叫 Worksheet 物件的 delete_cols() 方法可從指定的欄索引開始刪除一個或多個空欄, 語法為 :
工作表物件.delete_cols(idx [, num=1])
其中 idx 為欲刪除的欄索引 (1 起始的整數, 1 對應 A 欄, 2 對應 B 欄, ... 其餘類推), 備選參數 num 為要刪除的欄數 (預設是 1 欄). 在上面的範例中已於工作表物件內插入三個空欄 :
>>> for row in sheet1.rows:
for cell in row:
print(cell. value, end='\t')
print()
None 國文 None None None 英文 數學 總分
李小白 94 None None None 60 49 =SUM(B2:D2)
杜小甫 85 None None None 75 76 =SUM(B3:D3)
王小維 77 None None None 85 65 =SUM(B4:D4)
現在要呼叫 delete_cols() 方法來刪除列 3, 4, 5 這三個空白欄, 若只傳入欄索引 3 表示只刪除第三欄這一欄 (即 C 欄), 例如 :
>>> sheet1.delete_cols(3) # 只刪除第三欄 (C 欄)
>>> for row in sheet1.rows:
for cell in row:
print(cell. value, end='\t')
print()
None 國文 None None 英文 數學 總分
李小白 94 None None 60 49 =SUM(B2:D2)
杜小甫 85 None None 75 76 =SUM(B3:D3)
王小維 77 None None 85 65 =SUM(B4:D4)
可見第一個空白欄 (C 欄) 已被刪除, 現在剩下欄索引為 3, 4 的兩個空白欄 (原 C 欄被刪除後右邊個欄索引會往左補位). 若傳入第二參數 num 則可一次刪除從 idx 起往右的連續多欄資料, 例如 :
>>> sheet1.delete_cols(3, 2) # 從欄索引 3 開始向右刪除連續 2 欄
>>> for row in sheet1.rows:
for cell in row:
print(cell. value, end='\t')
print()
None 國文 英文 數學 總分
李小白 94 60 49 =SUM(B2:D2)
杜小甫 85 75 76 =SUM(B3:D3)
王小維 77 85 65 =SUM(B4:D4)
可見所有空白欄都已經被刪除了.
(10). 呼叫工作表物件的 append() 方法添加資料於列尾 :
呼叫 Worksheet 物件的 append() 方法並傳入一個可迭代物件 (例如串列, 元組, 或字典) 可將其內容添加到工作表之列尾, 例如 :
>>> sheet1.append(['元小稹', 88, 34, 100, '=SUM(B5:D5)']) # 也可以用 tuple
>>> for row in sheet1.rows:
for cell in row:
print(cell. value, end='\t')
print()
None 國文 英文 數學 總分
李小白 94 60 49 =SUM(B2:D2)
杜小甫 85 75 76 =SUM(B3:D3)
王小維 77 85 65 =SUM(B4:D4)
元小稹 88 34 100 =SUM(B5:D5)
可見已在列尾添加新資料列. 注意, 公式寫入儲存格必須使用字串型態.
append() 也可以傳入字典, 這時必須以欄索引字串例如 'A', 'B', 'C', ... 等當作字典的鍵 (key), 例如 :
>>> new_row={'A':'岑小參', 'B':90, 'C':45, 'D':100, 'E':'=SUM(B6:D6)'} # 新資料
>>> sheet1.append(new_row) # 傳入字典
>>> for row in sheet1.rows:
for cell in row:
print(cell. value, end='\t')
print()
None 國文 英文 數學 總分
李小白 94 60 49 =SUM(B2:D2)
杜小甫 85 75 76 =SUM(B3:D3)
王小維 77 85 65 =SUM(B4:D4)
元小稹 88 34 100 =SUM(B5:D5)
岑小參 90 45 100 =SUM(B6:D6)
可見傳入的字典以添加於列尾.
(11). 呼叫 move_cells() 方法移動儲存格 :
此方法可將指定區域內的儲存格平移, 語法如下 :
工作表物件.move_range(range, rows=0, cols=0)
第一參數 range 是表示範圍的座標字串, 格式為 '左上角座標:右下角座標', 例如 'B2:E6'. 參數 rows 表示要往下 (正值) 或往上 (負值) 移動; 而 cols 表示要向右 (正值) 或往左 (負值) 移動, 因為兩者預設值均為 0, 故若不傳入此兩參數就不移動, 以上面的成績為例, 成績範圍位於 'B2:E6' :

若要向右向下平移兩格可以這麼做 :
>>> sheet1.move_range('B2:E6', rows=2, cols=2) # 'B2:E6' 向下向右移動兩格
>>> for row in sheet1.rows:
for cell in row:
print(cell. value, end='\t')
print()
None 國文 英文 數學 總分 None None
李小白 None None None None None None
杜小甫 None None None None None None
王小維 None None 94 70 49 =SUM(B2:D2)
元小稹 None None 85 75 76 =SUM(B3:D3)
岑小參 None None 77 85 65 =SUM(B4:D4)
None None None 88 34 100 =SUM(B5:D5)
None None None 90 45 100 =SUM(B6:D6)
可見平移後工作表從 6 列 5 欄變成 8 列 7 欄, 遺留的儲存格內容變成 None (空白), 原來 'B2:E6' 的成績儲存格被移到 'D4:G8', 若要移回去可以這麼做 :
>>> sheet1.move_range('D4:G8', rows=-2, cols=-2) # 'D4:G8' 向上向左移動兩格
>>> for row in sheet1.rows:
for cell in row:
print(cell. value, end='\t')
print()
None 國文 英文 數學 總分 None None
李小白 94 70 49 =SUM(B2:D2) None None
杜小甫 85 75 76 =SUM(B3:D3) None None
王小維 77 85 65 =SUM(B4:D4) None None
元小稹 88 34 100 =SUM(B5:D5) None None
岑小參 90 45 100 =SUM(B6:D6) None None
None None None None None None None
None None None None None None None
>>> sheet1.max_row
8
>>> sheet1.max_column
7
可見雖然成績儲存格移回去了, 但遺留下來空白儲存格仍然存在, 工作表物件被撐大了, 必須呼叫 delete_rows() 與 delete_cols() 方法刪除這些空白欄與列, 例如 :
>>> sheet1.delete_rows(7, 2) # 刪除兩個空白列
>>> sheet1.delete_cols(6, 2) # 刪除兩個空白欄
>>> for row in sheet1.rows:
for cell in row:
print(cell. value, end='\t')
print()
None 國文 英文 數學 總分
李小白 94 70 49 =SUM(B2:D2)
杜小甫 85 75 76 =SUM(B3:D3)
王小維 77 85 65 =SUM(B4:D4)
元小稹 88 34 100 =SUM(B5:D5)
岑小參 90 45 100 =SUM(B6:D6)
這樣工作表物件就恢復原樣了.
(12). 呼叫 merge_cells() 與 unmerge_cells() 方法合併與取消合併儲存格 :
有時跨幾個列或欄位的儲存格需要合併為一個儲存格以便能顯示完整的內容, 這時可用工作表物件的 merge_cells() 方法來合併, 取消合併則呼叫 unmerge_cells(), 語法如下 :
工作表物件.merge_cells(range)
工作表物件.unmerge_cells(range)
參數 range 為欲合併儲存格的座標範圍字串, 例如 'A1:E1' 是合併第一列從 A1 到 E1 的五個儲存格, 而 'B2:C6' 為合併 B2 至 C6 的 10 個儲存格等.
以上面的 sheet1 工作表中的成績單為例, 如果在第一列欄名上面插入一個空白列, 然後在 A1 儲存格寫入標題後存檔, 結果如下 :
>>> sheet1.insert_rows(1) # 在第一列前面插入一個空白列
>>> sheet1['A1'].value='唐人班段考成績單' # 寫入 A1 儲存格
>>> sheet1.merge_cells('A1:E1') # 合併 A1:E1 為一格
>>> for row in sheet1.rows:
for cell in row:
print(cell. value, end='\t')
print()
唐人班段考成績單 None None None None
None 國文 英文 數學 總分
李小白 94 70 49 =SUM(B2:D2)
杜小甫 85 75 76 =SUM(B3:D3)
王小維 77 85 65 =SUM(B4:D4)
元小稹 88 34 100 =SUM(B5:D5)
岑小參 90 45 100 =SUM(B6:D6)
>>> wb.save('scores.xlsx') # 存檔
這時用 Excel 開啟 scores.xlsx 檔 :

可見第一列標題列所占的五個儲存格已經合併為一格. 關閉檔案後呼叫 unmerge_cells() 取消合併, 例如 :
>>> sheet1.unmerge_cells('A1:E1')
>>> wb.save('scores.xlsx')
再次用 Excel 開啟 scores.xlsx :
可見第一列那五個儲存格已經被取消合併了.
(13). 呼叫工作表物件的 add_image() 於儲存格中插入圖片 :
儲存格的內容除了文數字外也可以是圖片, 呼叫工作表物件的 add_image() 方法可在儲存格中插入圖片, 但需要先利用 openpyxl.drawing.image 中的 Image 類別將 jpg/png 等圖檔打包成 Image 物件傳入 add_image() 方法中, 所以需額外匯入 Image 類別 :
from openpyxl.drawing.image import Image
此處使用的 say_hello.jpg 圖片如下 :

按滑鼠右鍵選 "另存圖片" 將此圖檔下載後放在與程式相同之工作目錄中, 這樣就可以建立 Image 物件實例, 然後呼叫工作表物件的 add_image() 方法將其插入上面 sheet1 的 B9 欄位, 例如 :
>>> from openpyxl.drawing.image import Image
>>> img=Image('say_hello.jpg')
>>> type(img)
<class 'openpyxl.drawing.image.Image'>
>>> sheet1.add_image(img, 'B9')
>>> wb.save('scores.xlsx')
存檔後用 Excel 開啟 scores.xlsx :

可見圖片已插入 B9 儲存格中.
(14). 利用工作表物件的 freeze_panes 凍結儲存格 :
工作表物件的屬性 freeze_panes 可用來凍結指定儲存格上方的所有列以及左方的所有欄, 但不包括該儲存格本身, 這樣當捲動垂直卷軸時, 被凍結的儲存格會定在原位不動, 語法如下 :
工作表物件.freeze_panes='儲存格座標'
freeze_pane 預設值為 None, 表示無儲存格被凍結. 它通常被設為 'A2' 用來凍結第一列, 因為第一列一般是做為欄名, 當資料列很長往下捲動時, 若第一列的欄名不隨之捲動有助於資料閱讀.
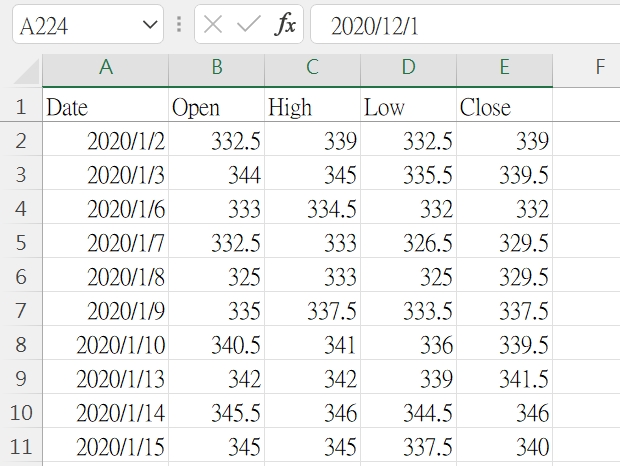
此處使用台積電 2020 年的每日盤後資訊為例說明 (可在開頭下載第三個範例檔 tw2330.xlsx) :

>>> wb=xl.load_workbook('tw2330.xlsx')
>>> sheet=wb.active
>>> sheet.max_row
246
>>> sheet.max_column
5
可見此工作表內有 246 列資料, 當往下捲動時, 第一列的欄名就不見了, 這樣就不知道儲存格上的數據到底是甚麼價格了 :

如果將 freeze_panes 設為第二列第一欄的座標 'A2', 則其上方的第一列會被凍結 :
>>> sheet.freeze_panes='A2' # 凍結 'A2' 上方與左方所有儲存格
>>> wb.save('tw2330.xlsx') # 存檔
這時再開啟 tw2330.xlsx 會發現第一欄底下多了一條線, 標示該欄已被凍結 :
即使捲動到最底端, 被凍結的第一列仍然不動 :

以上便是 OpenPyXL 的主要功能, 如果只是要用 xlsx 當作小型資料庫, 這樣應該就綽綽有餘了, 剩下的是比較次要的格式調整與圖表繪製 (大量自動化處理 xlsx 檔可能會用到), 留待下一篇再處理. 離前一篇已超過半年, 若不是參加這次線上課程的觸發, 關於 OpenPyXL 的測試學習不知要拖到何時才能完成呢.
參考 :
沒有留言 :
張貼留言